


 |
Analytics Overview
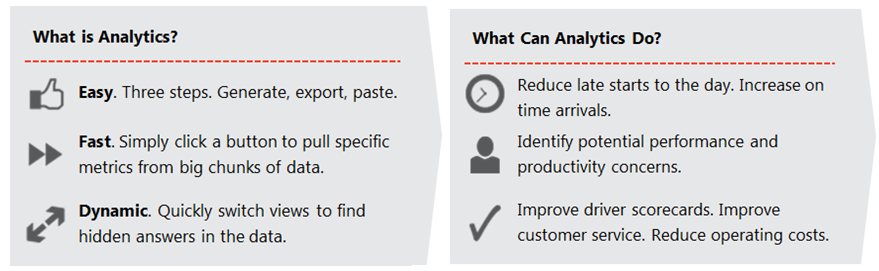
FleetOutlook Analytics enable you to quickly paste FleetOutlook report data into a ready-to-use template to study and identify trends across your fleet. Use the analytics-ready output to manipulate multiple dimensions of FleetOutlook data over days, weeks or even several months by simply clicking pre-defined filter buttons within the templates.
Device Activity Report
Download Device Activity Template (Excel 2010) >
Download Device Activity Template (Excel 2013) >
Use this template and report output to understand device behavior by latest event type, latest travel status and interruption. Compare device status by group and vehicle category.
Driver Performance Report
Download Driver Performance Template (Excel 2010) >
Download Driver Performance Template (Excel 2013) >
Use this template and report output to create performance analytics or to create custom scorecards. You can drill down and across to study work performance by driver or group over a specified reporting interval. For example, you can filter to study weekend data outside of work week hours. You can study driver performance by individual days to compare Monday-to-Monday data. Additionally, you can create custom filters to isolate the performance metrics most important to your fleet.
Driver Scorecard Report
Download Driver Scorecard Template (Excel 2013) >
Use this template and report output to study work performance and behavior for an individual driver or measure group-by-group comparisons over a specified reporting interval, and then isolate the metrics most important to you. Focus on your Key Performance Indicators (KPIs), such as identifying distance driven, posted-speed limit violations and hard-braking events.
Driver Utilization Report
Download Driver Utilization Report (Excel 2010) >
Download Driver Utilization Report (Excel 2013) >
Use this template and report output to study both the current and historical trends for the key measurements important to your bottom line, such as identifying chronic overtime, late departures on specific days of the week and high travel averages when compared to the rest of the group.
Trip Report
Download Trip Report Template (Excel 2010) >
Use this template and report output to study trip characteristics across your fleet. Sort and filter to isolate arrival and departure times, stop locations, frequency of common trips, drive time to common locations and first/last stops of the day. The Trip Report analytics output breaks the workday up into significant legs, and each leg is associated with a “significant” destination. Short stops, for coffee or a phone call, are considered part of travel time, resulting in a concise and easy-to-follow workday report.
Vehicle Metrics Report
Download Vehicle Metrics Template (Excel 2013) >
Use this template and report output to study overall fleet metrics and vehicle use. Monitor when fuel efficiency is adversely affected by leaving the truck running while not moving, and PTO is not engaged. Study total working and waste Idles for each vehicle in your fleet or compare group-by-group usage.