


 |
Fleet Utilization
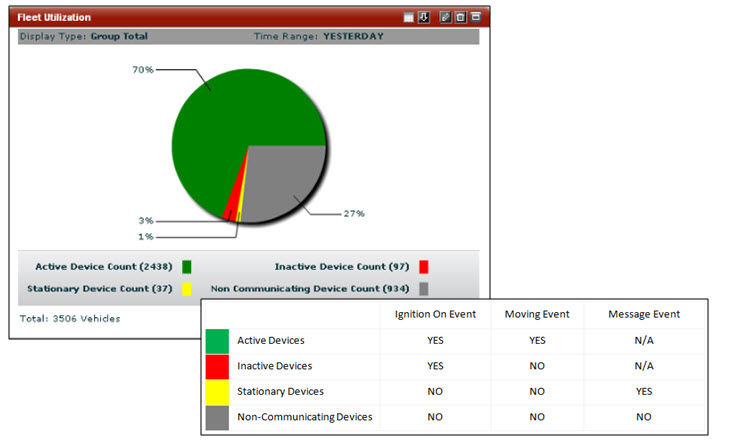
This dashlet depicts vehicle use in pie chart form for the selected date range. The pie chart shows the size of each of the four statuses proportional to the total number of devices. The dashlet is beneficial to fleet managers as they balance their daily fleet load to minimize maintenance costs and maximize vehicle use.
|
Active Devices |
Devices that have reported an Ignition On and moving events that day. |
|
Inactive Devices |
Devices that have not reported any Ignition On or moving events that day, but have reported other events. |
|
Stationary Devices |
Devices that have reported an Ignition On but no moving events that day. |
|
Non-Communicating Devices |
Devices that have not reported any events or messages of any kind. |