|
Equipment Utilization
The Equipment Utilization chart provides information about the overall use of equipment by active days or active hours. Each chart renders its data based on user-defined configurations and updates automatically.
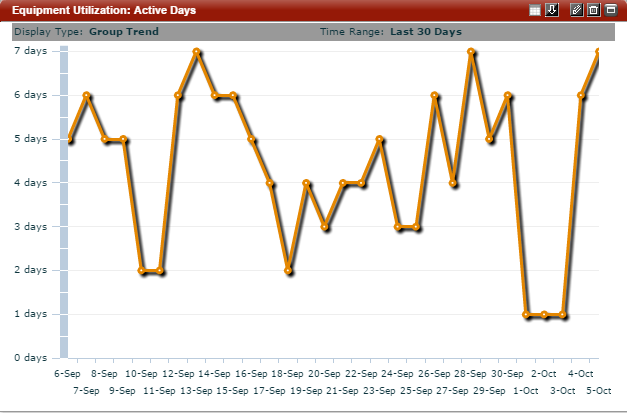
Active Days Count
Displays which pieces of equipment or vehicles were the most active during the selected reporting interval. This chart view provides a view into a fleet's under- or over-utilization of equipment. To view a fleet's overall utilization, select Group Trend to understand how many assets were active on each of the selected reporting interval.

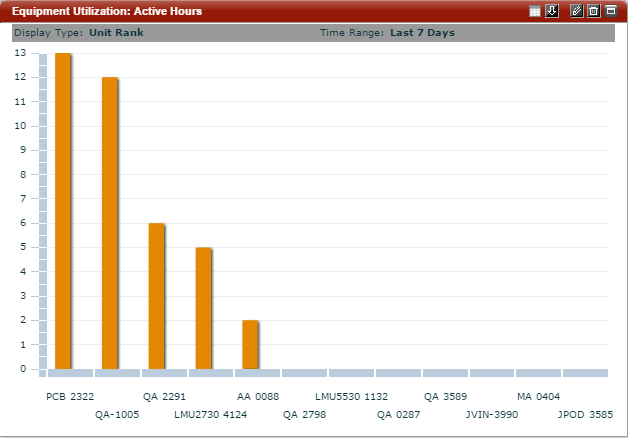
Active Hours
Displays how many hours each piece of equipment in the selected group or fleet operated for the specified reporting interval. This chart helps fleet managers view over- and under-utilization across their mixed use fleet, as the chart will contain both vehicles and equipment.